MuonPi - Grafana
This article will explain how to view your detector data using the MuonPi Grafana Dashboards. Most of the panels on a dashboard have a small information icon on the top left with a quick explanation of what is shown within the panel.
DISCLAIMER: Internet connection required. Tutorial written based on the layout in December 2020.
Contents
Login to our Grafana service
As a user/host of a detector with an LDAP account, you have the option to log in to Grafana to view an extensive record of data collected by the MuonPi network.
- Simply go to Grafana and click the login button on the lower left of the screen. Log in using your LDAP credentials received through one of our admins.
- Use the search function (top left) to display all available dashboards. There are several options and different drop-down menus.
- Choose the "Logstats for Users" dashboard. Currently, the loading time can be up to several minutes due to a large load on the server.
- Under the drop-down menu "user_id_string" you can select your user account and display various different data uplinked by your detector. If you have more than one detector, all of your stations will be displayed on this page.
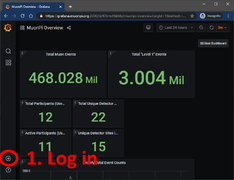
Step 1: Log in
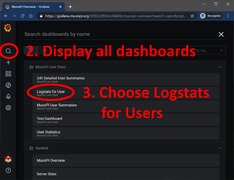
Step 2: Search for dashboards
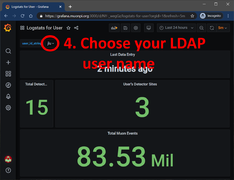
Step 3 & 4: Choose "Logstats for Users" and select your LDAP user name


MuonPi Dashboards
In this chapter, different dashboards will be introduced. Before diving in, a short summary of measurement variables and definitions is given in the following.
Terminology
Some of the measurements on the MuonPi dashboards can have a rather technical nomenclature, here a short introduction to some of the variables.
- XOR Count Rate: Our MuonPi hat has two independent signal input channels. Using a XOR gate we can summarize the two channels to one: with XOR logic, we only get a contribution to the count rate when either of the channels sees an event. In practice, most of the issued stations only use a single detector with a single channel. Thus, the XOR rate corresponds to the detector count rate.
- L1 Events: To get a hold of the immense amount of incoming data, we perform online data processing to find interesting data matches. If two or more events occur "coincidentally", that is, in a short defined time window, then these events get grouped to an L1 Event for further data processing. The level of an L1 Event is defined by the amount of matched events, where the lowest level is, by definition, two. All other events are of course not thrown away, since they, too, can yield meaningful results.
- GNSS refers to the Global Navigation Satellite System that not only includes the GPS satellites, but also European, Chinese, and Russian services with Japanese and Indian contribution planned for the future.
Public Dashboards
Without logging in to Grafana, one public dashboard is available:
- MuonPi Overview: on this dashboard, you will find general statistics of the MuonPi network, e.g. the total number of measured events, the total number of so-called "Level 1" events, number of registered users, and unique detectors, etc. A map of online detectors is also presented. The actual detector location on this map is slightly distorted to guarantee user privacy.
User-only Dashboards
As a MuonPi user, e.g. a supporter and host of a detector unit, one has access to most of the data measured with the MuonPi detector network. This data can be displayed most conveniently sorted by users. Additionally, more in-depth meta-data of the detector network is shown.
Logstats for Users

The probably most important dashboard for our MuonPi users: here one can find all upstreamed data sorted by user. On the top-left of this dashboard, one can choose the user ID and display the corresponding data. If a user operates more than one station then the data will be combined in the different entries below.
- Last Data Entry shows when the last data package arrived from the user. This can be helpful for debugging.
- Total Detector Sites shows the total number of online detectors within the selected time interval.
- User's Detector Sites shows the total number of online detectors operated by the user within the selected time interval.
- Total Muon Events shows the total amount of measured events from the user's detectors.
- Total Events in Interval shows the total amount of measured events from the user's detectors within the time interval.
- Rate Stats shows the "exclusive or" (XOR) rate, the rate of incoming events at the server (message rate) and the event rate as measured by the hardware counter in the Ublox chip (Ublox counter progress) as an independent measurement.
- GPIO Rates shows the event rate registered at the GPIO pins of the Raspberry Pi only. In opposite to the rate stats, beside the XOR rate also the AND rate is shown here. This is usually meaningful when the coincidence of the two hardware channels is of interest, like e.g. the coincidence rate between two connected detectors.
- Timestamping Accuracy shows the single detector time accuracy of the event timestamps. This value is usually some tens of nanoseconds and is determined by the quality and quantity of the GNSS reception. This time stamping accuracy is not to be confused with the overall time resolution of the detector, even though both measures are related to the GNSS reception.
- Temperature shows the temperature as measured on-board from the Raspberry Pi.
- GNSS clock drift indicates the drift in frequency of the on-board local oscillator compared to the ultra-stable GNSS clock frequency. The on-board oscillator is compensated for the drift through this comparison.
- GNSS Satellites shows the number of currently received GNSS satellites and the number of satellites that are considered for the positioning solution (position fix).
- GNSS max CNR The reception field strength of the GNNS satellite with the strongest signal. The value indicates the margin of the carrier signal to the noise floor (Carrier-to-Noise Ratio CNR).
- GNSS Preamp Noise Floor The currently observed noise floor at the GNSS-RX input in absolute logarithmic units referred to 1 mW per Hz.
- GNSS RX Jamming Level A measurement for the existence of modulated interference in the reception bandwidth.
- SiPM Bias Voltage and SiPM Bias Current show the measured applied bias voltage and the resulting current drawn to power the Silicon photomultiplier photodiode on the detector. The nominal values are some tens of microampere at 32V.
- Thresholds (!)
- Ublox Event Pulse Length The length of the digital pulse at the u-Blox interrupt input. The MuonPi electronics provides, depending on the selection of the timestamping source, signals with ~100 ns (discriminator outputs) or ~1 µs (XOR, AND signals).
- Position Accuracy shows the geographical position accuracy given by the GNSS reception.
- Ublox Event Counter A 16bit hardware counter internal to the u-Blox receiver chip. This counter provides an observable to the true detector count rate without dead-time effects. The timestamped events are usually registered at a lower rate since the u-Blox logic can only assert one external interrupt for timestamping every navigation epoch. The navigation epochs are at minimum 100 ms for the u-Blox NEO 7 and 8 chips.
- Detector Location shows the average location of the detector during the chosen time interval. The circle is color-coded based on position accuracy (note the color legend).
- Geographic Coordinates shows the coordinates in latitude, longitude, and height above MSL (mean sea level).
- Station CPU Load shows the CPU load average of the Raspberry Pi.
- Station Free Memory shows the Free Memory and the Free Swap of the Raspberry Pi.
- Coincidence Level shows the Level of matched L1 Events.

- Coincidence Events shows the hourly number of L1 Events.
- Coincidence Time shows the time difference in microseconds for matched events (L1 Events) to the other detector. The time window for searching L1 Events is 10 microseconds. If two detectors are operated close by (stacked or next to each other), an accumulation of L1 Events close to 0 coincidence time can be found (see graphic). All other entries are random coincidences within the ten-microsecond search window.
- Station Uptime shows the time since the last reboot of the detector station.