MuonPi - Grafana
This article will explain how to view your detector data using the MuonPi Grafana Dashboards.
DISCLAIMER: Internet connection required. Tutorial written based on the layout in December 2020.
Contents
Login to our Grafana service
As a user/host of a detector with an LDAP account, you have the option to log in to Grafana to view an extensive record of data collected by the MuonPi network.
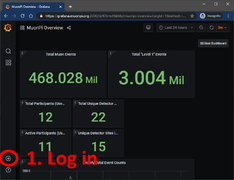
- Simply go to Grafana and click the login button on the lower left of the screen. Log in using your LDAP credentials received through one of our admins.
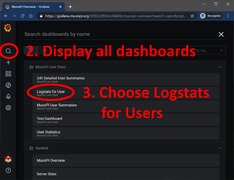
- Use the search function (top left) to display all available dashboards. There are several options and different drop-down menus.
- Choose the "Logstats for Users" dashboard. Currently, the loading time can be up to several minutes due to a large load on the server.
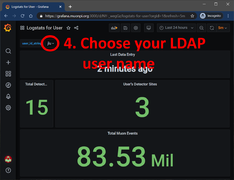
- Under the drop-down menu "user_id_string" you can select your user account and display various different data uplinked by your detector. If you have more than one detector, all of your stations will be displayed within this page.
MuonPi Dashboards
In this chapter, different dashboards will be introduced.
Public Dashboards
Without logging in to Grafana, one public dashboards is available:
- MuonPi Overview: on this dashboard, you will find general statistics of the MuonPi network, e.g. the total number of measured events, the total number of so-called "Level 1" events, number of registered users, and unique detectors, etc. A map of online detectors is also presented. The actual detector location on this map is slightly distorted to guarantee user privacy.
User-only Dashboards
As a MuonPi user, e.g. a supporter and host of a detector unit, one has access to most of the data measured with the MuonPi detector network. This data can be displayed most conveniently sorted by users. Additionally, more in-depth meta-data of the detector network is shown.
Logstats for User
The probably most important dashboard for our the MuonPi users: here one can find all upstreamed data sorted by user. On the top-left of this dashboard, one can choose the user ID and display the corresponding data. If a user operates more than one station then the data will be combined in the different entries below.
- Last Data Entry shows when the last data package arrived from the user. This can be helpful for debugging.
- Total Detector Sites shows the total number of online detectors within the chosen time interval.
- User's Detector Sites shows the total number of online detectors operated by the user within the chose time interval.
- Total Muon Events shows the total amount of measured events from the user's detectors.
- Total Events in Interval shows the total amount of measured events from the user's detectors within the time interval.
- XOR Rate Stats shows the


