GUI and Detector Operation
This article will explain to best operate the detector and how to use the GUI
DISCLAIMER: Tutorial written based on GUI version 2.0.2
Detector Operation
Finding the right threshold
There are several ways to find the right detector threshold. In general, one aims to minimize the amount of electronic noise while not sacrificing real detector counts.
- Method 0: The choice of threshold should always be guided by the expected integrated muon flux per m2 and second in the detector. For our large detector (25cm x 12.5 cm), this is roughly 3.5Hz. For our small hexagonal detector, this is roughly 1Hz. For a more in-depth choice of threshold, follow the other methods.
- Method 1: Using an oscilloscope (details to be added)
- Method 2: Using the energy processor (details to be added)
- Method 3: Another way to accomplish this, and without having to use additional equipment, is a threshold scan using the GUI. Here, the software is automatically setting different threshold levels and measuring the number of counts measured per time interval. Thus, by creating a graph showing count rate versus threshold, one can make an informed decision on how to choose the right threshold level.
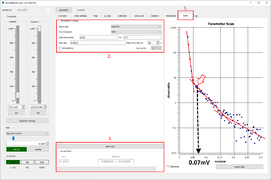
- Open GUI and navigate to the "Scans" page.
- Set "UBXRATE" as observable and "THR1" (if using channel one of the board) or "THR2" (if using channel two). Select meaningful values for the scan range: test by hand (using the Threshold slider) to find a high count rate (blue LED on HAT board permanently on) and where the counts practically disappear (blue LED permanently off). Those to values can be set as "Scan range from" and "To". To get good statistics, choose 0.0025 as step size and 20s as "Meas. time interval".
- Press "Start scan". The scan might take several minutes, depending on your effective scan range. The progress is displayed on the bottom of the page.
- When the scan is done, right-click on the y-axis of the plot and select "Log Y" to show the plot in log scale.
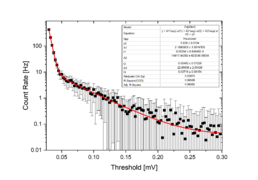
- Choosing the right threshold value. The result in your GUI should look similar to Screenshot 1 in the gallery below. A steep drop in count rate for very low thresholds turns into a less steep drop. At this point, the electronic background is effectively cut and only real detector signals are measured. To avoid measuring a great number of dark counts (signal-like events produced by the photosensors) one wants to set the threshold well above the point where the slope changes. In this example, we chose a value 20mV above that point. In screenshot 2 the data is fitted with an exponential decay function with three decay constants for reference. The data was taken with a large (25cm x 12.5 cm) detector.
- The threshold that was found across the previous steps should be persisted to the non-volatile memory of the DAC device. This is achieved by clicking the "Store DAC settings" button on the left side bar of the GUI. In this way, the new threshold is automatically set after restart or after a power cycle.

