Difference between revisions of "MuonPi - Grafana"
Jump to navigation
Jump to search
(Created page with "This article will explain how to view your detector data using the MuonPi Grafana Dashboards DISCLAIMER: Internet connection required. __TOC__ = Login to our Grafana service =") |
|||
| Line 1: | Line 1: | ||
| − | This article will explain how to view your detector data using the MuonPi Grafana Dashboards | + | This article will explain how to view your detector data using the MuonPi Grafana Dashboards. |
DISCLAIMER: Internet connection required. | DISCLAIMER: Internet connection required. | ||
| Line 6: | Line 6: | ||
= Login to our Grafana service = | = Login to our Grafana service = | ||
| + | |||
| + | As a user/host of a detector with an LDAP account, you have the option to log in to Grafana to view an extensive record of data collected by the MuonPi network. | ||
| + | # Simply go to [https://grafana.muonpi.org Grafana] and click the login button on the lower left of the screen. Log in using your LDAP credentials received through one of our admins. | ||
| + | # Use the search function (top left) to display all available dashboards. There are several options and different drop-down menus. | ||
| + | # Choose the "Logstats for Users" dashboard. Currently, the loading time can be up to several minutes due to a large load on the server. | ||
| + | # Under the drop-down menu "user_id_string" you can select your user account and display various different data uplinked by your detector. If you have more than one detector, all of your stations will be displayed within this page. | ||
| + | |||
| + | <gallery mode="packed-hover"> | ||
| + | Grafana_Tut_1.PNG|Step 1: Log in | ||
| + | Grafana_Tut_2.PNG|Step 2: Search for dashboards | ||
| + | Grafana_Tut_3.PNG|Step 3 & 4: Choose "Logstats for Users" and select your LDAP user name | ||
| + | </gallery> | ||
Revision as of 14:38, 13 December 2020
This article will explain how to view your detector data using the MuonPi Grafana Dashboards.
DISCLAIMER: Internet connection required.
Contents
Login to our Grafana service
As a user/host of a detector with an LDAP account, you have the option to log in to Grafana to view an extensive record of data collected by the MuonPi network.
- Simply go to Grafana and click the login button on the lower left of the screen. Log in using your LDAP credentials received through one of our admins.
- Use the search function (top left) to display all available dashboards. There are several options and different drop-down menus.
- Choose the "Logstats for Users" dashboard. Currently, the loading time can be up to several minutes due to a large load on the server.
- Under the drop-down menu "user_id_string" you can select your user account and display various different data uplinked by your detector. If you have more than one detector, all of your stations will be displayed within this page.
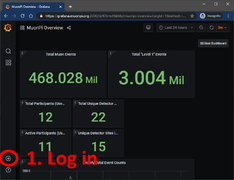
Step 1: Log in
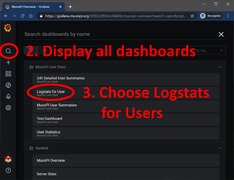
Step 2: Search for dashboards
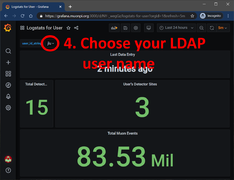
Step 3 & 4: Choose "Logstats for Users" and select your LDAP user name


